One of the questions we hear most often, especially from other investment advisors, is The Performance Question: How can you recommend a “Sustainable, Responsible, Impact” investment portfolio to your clients, when they under-perform regular market indexes?
The question seems to be based on one of two underlying assumptions. The first is not sophisticated, but makes intuitive sense: if you’re giving up the opportunity to profit from the legal but questionable activities of the companies that are screened out of most SRI portfolios, you must underperform un-screened portfolios. The second is more theoretically sophisticated, but is less intuitive: if you limit the “universe” of investable securities by screening out companies that fall short of your SRI guidelines, your portfolio must have lower returns and higher risk than un-screened portfolios.
Observers from academia and participants from major market participants have published study after study on the question; The Forum for Sustainable and Responsible Investment, our industry association, has collected many of these studies in one place for us. The main upshot of these studies is that portfolio screening does cause the performance of a screened portfolio to differ slightly from an un-screened portfolio — but over time those differences mostly cancel each other out, and the performance of screened portfolios are either equivalent to or slightly better than un-screened portfolios.
But another way to respond to this sort of question is to point to a single, simple graph: compare the performance of a screened index to a similar un-screened index. Here’s what we see:
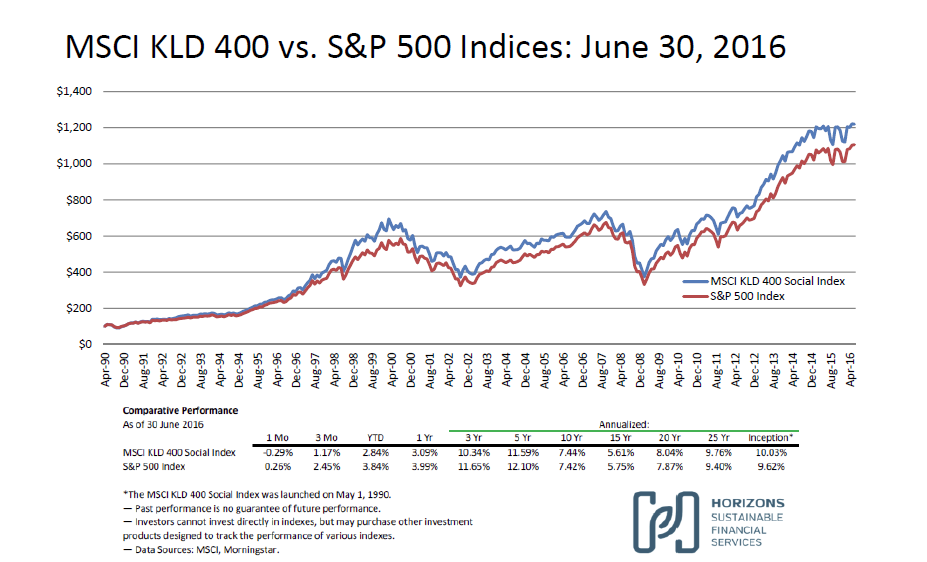
The screened index here is the “MSCI KLD 400 Social Index”, which was once known as the Domini 400. It takes the largest stocks on US markets, excludes the “securities of companies involved in Nuclear Power, Tobacco, Alcohol, Gambling, Military Weapons, Civilian Firearms, GMOs, and Adult Entertainment”, and tries to keep the sector weightings in line with the broader market. The un-screened index here is the familiar “Standard & Poor’s 500” (often called just “the S&P” on the nightly news) which represents the five hundred largest stocks on US markets, and is frequently used to represent “the market” itself.
Of course, past results are no guarantee of future performance. But the KLD 400 has been in operation for just over 26 years, and in that time it has on average outperformed the S&P 500 by 0.41% annually. There are about as many explanations offered for SRI outperformance as there are academic and industry studies describing it, and we don’t know which ones might be best. We’re just glad to know that our clients have, over the long haul, been able to do well while doing good.